
Monday, March 21, 2016
Shuttered Walmart Stores

Wednesday, December 17, 2014
The power of video and the lack of details. The dangers of policiing
Recently on Facebook I saw a post someone had shared from Uniform Stories, a Facebook page whose short description describes the page as "Giving a voice to military, police, fire and ems personnel…one story at a time. www.UniformStories.com".
The video post is titled "The Dangers of Policing" and is caption with the following, "Let's show a bit more appreciation for the sacrifices police make for our communities. After all, they're all that stands between the monsters and the weak."
The video appears to be copy of a ABC Nightly News broadcast that highlights multiple attacks on police half of which the assailants are armed. With chilling background music it goes through 15 separate video while highlighting in bold text "108, the number of duty deaths in 2014". Actually the year is not yet over but I decided to take a look at those numbers.
Now don't get me wrong, law enforcement is a tough job at best but in this time of heightened emotions don't let those emotions cloud facts. To imply that every death is from gunfire our other assaults is just plain wrong.
The number 108 which has been quoted in the media a bit lately comes from a webpage called Officer Down Memorial Page (www.odmp.org). The memorial page includes a database for each fallen officer and canine on duty.
Looking at the video you begin to notice three main themes. The 108 number includes:
Note: After review the description of the cause of death of Mississippi Game Warden John Collum, I decided to reclassify it from Vehicle Assault to Vehicle Pursuit. The officer was struck by a 19 year old man who was not involved in the initial crime. Although the driver was charged negligent homicide he was unaware of who he struck at the time of the accident.
The video post is titled "The Dangers of Policing" and is caption with the following, "Let's show a bit more appreciation for the sacrifices police make for our communities. After all, they're all that stands between the monsters and the weak."
The video appears to be copy of a ABC Nightly News broadcast that highlights multiple attacks on police half of which the assailants are armed. With chilling background music it goes through 15 separate video while highlighting in bold text "108, the number of duty deaths in 2014". Actually the year is not yet over but I decided to take a look at those numbers.
Now don't get me wrong, law enforcement is a tough job at best but in this time of heightened emotions don't let those emotions cloud facts. To imply that every death is from gunfire our other assaults is just plain wrong.
The number 108 which has been quoted in the media a bit lately comes from a webpage called Officer Down Memorial Page (www.odmp.org). The memorial page includes a database for each fallen officer and canine on duty.
Looking at the video you begin to notice three main themes. The 108 number includes:
- assaults (whether with or with out gunfire) on
- municipal police, sheriffs deputies, and state troopers,
- while confronting "monsters"
I decided to analyze the exact same data and came up with some interesting numbers that highlight the power of obfuscation. What I found is that some of the clips in the video which could be identified did not even happen in 2014. When they narrator mentions a SEPTA officer (Southeast Pennsylvania Transportation Authority), I could not find any officer that worked for that agency within the database. Likewise the clip at 0:14 that occurred in West Union I could not find any listing in the database although I was able to find this video that showed the officer getting back up.
What I did find out that more than just municipal police officers, sheriffs and state troopers the list of officers down included federal, state, city officials as well as employees of the US Navy, US Forest Service, Navajo Reservation Police, Border Patrol Agents, and even Corrections Officers. Killed by gunfire. Not likely most experienced heart attacks or were involved in traffic accidents, not exactly video worthy.
So lets get started and look at the data. Here is a map of the database that I geo-coded and highlighted by cause of death. As for officers killed in the line of duty exactly half (fig. 1) are due to assaults (which includes gunfire, "assault", and vehicle assault). Actually the third highest cause of death is from a heart attack (fig 2). Gunfire accounted for less than 40% of all fallen officers (43).
And the belief that they are all police, sheriffs, and state troopers is also an obfuscation. Included in the "other" category; BART police (accidental shooting by partner), US Navy Security Forces (gunfire), Corrections Officers (heart attack), Fish and Game Wardens (auto accident), Border Patrol (auto accident), Animal Control Officer (auto accident), School District Cops (heart attack), University Police (heart attack), US Veterans Affairs Officer (heart attack).
Here is a link to the database taken from the Officer Down website.
 |
| Geo-coded map of Officer Down |
So lets get started and look at the data. Here is a map of the database that I geo-coded and highlighted by cause of death. As for officers killed in the line of duty exactly half (fig. 1) are due to assaults (which includes gunfire, "assault", and vehicle assault). Actually the third highest cause of death is from a heart attack (fig 2). Gunfire accounted for less than 40% of all fallen officers (43).
And the belief that they are all police, sheriffs, and state troopers is also an obfuscation. Included in the "other" category; BART police (accidental shooting by partner), US Navy Security Forces (gunfire), Corrections Officers (heart attack), Fish and Game Wardens (auto accident), Border Patrol (auto accident), Animal Control Officer (auto accident), School District Cops (heart attack), University Police (heart attack), US Veterans Affairs Officer (heart attack).
Here is a link to the database taken from the Officer Down website.
 |
| Fig 1 |
 |
| Fig. 2 |
 |
| Fig. 3 |
Note: After review the description of the cause of death of Mississippi Game Warden John Collum, I decided to reclassify it from Vehicle Assault to Vehicle Pursuit. The officer was struck by a 19 year old man who was not involved in the initial crime. Although the driver was charged negligent homicide he was unaware of who he struck at the time of the accident.
Monday, December 8, 2014
After cutbacks East Bay MUD to consider emergency water purchases.
The East Bay Municipal Utility District (EBMUD) board will meet tomorrow, Tuesday, December 9 to consider a staff recommendation to purchase emergency drought water supplies in addition to raising water bills to pay for it. According to EBMUD, a call for increased customer conservation, a second purchase of federal water and a 15 percent surcharge on all water used by customers will be among the staff recommendations before the District Board of Directors.

This past April, EBMUD purchased and delivered about 18,600 acre feet of water from the Sacramento River through its federal Central Valley Project (CVP) contract. One acre foot is 325,851 gallons, or approximately the amount of water used by three average East Bay households in a year. The approximate $8 million cost of purchasing, pumping and treating that water was absorbed by the district through a surplus sale of a Castro Valley property and budget savings over the past fiscal year.
Tomorrow, the Board of Directorswill consider making a second purchase of federal water before a February 28 deadline when its current CVP allocation expires. EBMUD has 41,625 acre feet available to purchase before the deadline. Staff will recommend the board approve purchasing 16,000 acre feet starting in January to refill local reservoirs. If a federal allocation is received on March 1 and if there has not been enough precipitation in the EBMUD watershed, staff will recommend making an additional purchase of up to 19,000 acre feet.
 |
| Freeport Intake on the Sacramento River |
According to a quote by John Coleman, a water board member from the Walnut Creek District, highlighted in an Inside Bay Area News story, "the delivery from the Sacramento River is a history milestone in protecting customers against shortages. We spent decades and hundreds of millions of dollars ot come up with a collaborative project, Now I feel it's proper to say it's time to take it."
If the drought continues into next summer, staff is recommending higher surcharges be considered to recoup the costs of future water purchases, increased conservation outreach and lost revenue due to the drought.
TIMELINE FOR EBMUD's SACRAMENTO RIVER WATER SUPPLY
1970 -- EBMUD signs federal contract to divert water from American River but has no way to deliver it.
1972 -- EBMUD is sued to block the diversion.
1990 -- EBMUD and Sacramento County Water Agency begin water negotiations.
2002 -- Deal is struck for EBMUD and Sacramento County Water Agency to build joint project at Freeport to divert Sacramento River water for both regions
2011 -- Joint water project is finished, and Sacramento County takes first water.
2014 -- EBMUD begins pumping Sacramento River water to East Bay.
Oakland Tribune: TIMELINE FOR EBMUD's SACRAMENTO RIVER WATER SUPPLY
1970 -- EBMUD signs federal contract to divert water from American River but has no way to deliver it.
1972 -- EBMUD is sued to block the diversion.
1990 -- EBMUD and Sacramento County Water Agency begin water negotiations.
2002 -- Deal is struck for EBMUD and Sacramento County Water Agency to build joint project at Freeport to divert Sacramento River water for both regions
2011 -- Joint water project is finished, and Sacramento County takes first water.
2014 -- EBMUD begins pumping Sacramento River water to East Bay.
Oakland Tribune editorial: EBMUD voters who care about controlling costs and tempering rate increases should back Katy Foulkes
http://www.mercurynews.com/my-town/ci_27080005/ebmud-decide-raising-rates-and-buying-emergency-water?source=autofeed#
Wednesday, December 3, 2014
More interesting country comparisons - Lessons from Japan?
Within the last five years who hasn't encountered on of these guys or gals depicted in this Portlandia skit. Dressed in their Rapha bike gear, with their distinctive Chrome bag atop their lasted fixie bike, they strut a style.
The more I see them showing up at City Hall in their Caltrans Orange or their neon green safety vests I remember attending Mikael Coleville-Andersen's talk in San Francisco.
"In Copenhagen we don't give our bicycles special names, we don't were special clothes to cycle in; the bicycle is just a tool to get around town. Americans don't give their vacuum cleaners names and they don't dress up to vacuum the carpet, why do you when you ride a bike. "
This Google street view photo (below) was taken less than 200 feet from the front door of the house I lived in while studying in Japan. This mother has a child in the front and a seat for the older child in the back with the front area of the bike for shopping and groceries.
She doesn't wear special clothes, she isn't part of some subculture. She is just a mom on a bike. Maybe when bicycling gets close to the 15% share level we will see how extravagant all this "bike posing" is.

Lesson from Japan?
Most of the time I generally ignore the Roadshow column in the San Jose Mercury News. It ends up being mostly compilations of the same old complaints on local roadways. But Sunday's column caught my eye. Local residents were complaining about neighbors using traffic safety cones to reserve parking spaces in front of their property. After reading a couple of readers letters, two immediate thoughts came to mind; How cities don't realize the negative consequence of free public goods; in this case on-street parking.
Since parking is free, soon residents begin to think that the free parking rights are included with the property. Wrong. But try convincing a car dependent homeowner otherwise.
The second though that came to mind was how we solve problems and challenges in this country. We very rarely look to other cites, states, or countries to see what others have tried and figure out why it did or didn't work.
In Tokyo you would not have a problem with neighbors reserving parking spaces; because no one is allowed to park overnight and daytime parking is allowed only in metered spaces. That's right, no on-street parking at any cost. It's called the "Proof of Parking Law" and it was explained to me by Nobu the oldest son of the family I lived with while a student in Tokyo. He said that before you can by a car in Tokyo you have to present you Proof of Parking Permit (Shako Shomei-sho) issued by a local Tokyo Police Department office. This is top of many other taxes and required permits.
Do they have these type of problems in Japan? No not at all.
Do they have these type of problems in Japan? No not at all.
 |
| A Google Street View of my residence while a student in Japan. |
When parking is so freely available, whether at work, at home, or at the grocery story it is difficult for a city to reduce vehicle miles traveled or VMT. No matter how ambitious you General Plan is, if the system is set up to subsidize private automobile operation getting people out of their cars will be an uphill battle.
Friday, August 16, 2013
DC Bike Party on Streetfilms
Rarely does Streetfilms produce videos on bike events or bike culture. They tend to feature policy issues. But Clearance Eckerson was in town to cover other policy related issues in our capital so he stopped by the montly ride.
DC Bike Party recently celebrated their one year anniversary. The ride is a once a month ride with a theme each month. This month the theme was Toga, Toga, Toga.
DC Bike Party recently celebrated their one year anniversary. The ride is a once a month ride with a theme each month. This month the theme was Toga, Toga, Toga.
Thursday, June 20, 2013
In Portland they 'put a bird on it'. In San Jose let's 'put a corporate logo on it.'
 |
| Early morning crew removes the HP Pavilion sign from the new SAP Center @ San Jose |
SAP signed the five year deal valued at $8.4 million or $1.7 million per year with the proceeds being split up equally between the team and the City of San Jose. To put this in comparison the deal on the new Forty-Niner stadium in Santa Clara is valued at $220 million for 20 years (third largest deal ever) and the deal for ATT ballpark is valued at $50 million for 24 years. Yahoo also just signed signed a 10 year deal that will make that company the "exclusive online sports content, social networking, and photo and video sharing partner" for the Forty-Niners.
In a post on his blog, San Jose City Council member Sam Liccardo highlighted a recent independent study which showed that bring the Oakland A's to the city would benefit downtown business by about $83 million annually. Additionally the sale of the future ballpark's naming rights would also bring additional and much needed cash to the city. I'm not sure how naming rights funnel into city coffers. Do they get diluted into the city's general fund? Does it go for maintenance of the arena, or other city assets, such as downtown museums or parks?
But given that the naming rights game is somewhat new (except in the St. Louis area) and limited to mostly sports facilities how else could an innovative city such as San Jose expand the concept. In Japan they even extended it to the teams themselves such as the Seibu (Department Store) Lions which play in the Seibu Dome, the Nippon Ham (meat products) Fighters, and Yakult (Yogurt) Swallows baseball teams. I'll discuss more in my next post but until then; "put a bird on it".
Monday, May 20, 2013
Silver Creek High School cyclist killed this morning on Capitol Expressway.
 |
| RIP: Silver Creek High School student killed photo: dbking |
Silver Creek High School Principal Adolfo Laguna in this morning's San Jose Mercury News, stated "the (student's) death is a poignant reminder of how careful motorists, pedestrians and bicyclists have to be around the school area, particularly during rush hour. We want our students to be safe."
Dangerous By Design
Yes this student's tragic death is a poignant reminder; but asking motorists, pedestrians and bicyclist to be careful as a preventive measure against these types of incidents is completely wishful thinking. This intersection is dangerous by design.
Here are some reasons that make this intersection dangerous for drivers, cyclists, and pedestrians.

San Jose City Council member Pierluigi Oliverio has been championing 15 mph speed limits near schools but he is limited by California state law to only two lane streets, not 10 lane expressways. This expressway also known as" Capitol Raceway" is notorious for impromptu races among race tuned autos.
The intersection was designed to reduce congestion by increasing the speed at which autos can negotiate turns. As you can see in this photo (Google Maps), the intersections uses large radii turns creating a triangular area to place the traffic signal. This design to increase the speed of right turning cars is a safety risk to cyclists and pedestrians.
Given San Jose suburban development pattern this expressway channels a high volume of traffic to the freeway during rush hour, bringing large volumes of traffic and young students together in a dangerous mix. The school, with almost 2,500 students also creates its own commuter congestion with parents rushing to bring their students to school before heading on the freeway to go to work.
Crossing Capital Expressway subjects student, cyclists, pedestrians, and the elderly to a 200 foot crossing with no refuge or rest area in the middle of the intersection.
I am always amazed that we have been lead to believe that the suburbs are by design safe than cities. It is evident in this Wall Street Journal Blog post titled "Is Generation Y a "Game Changer" for housing?" The article quotes a financial services consultant who recently bought a 2,500-square-foot house in south San Francisco. The 23-year old single woman mentioned that she anticipates moving to the suburbs later in life, stating, "In my 20s, I definitely want to live downtown; I like the whole high-rise, in-the-city feel,” she said. “But, definitely when I have children, I want to live in a single-family home. It’s easier for parking, transportation and it’s safer to live in the suburbs away from the city."
The community should use this tragic incident as a starting point to do something about the lack of safety so close to their children's school.
A side note: When I went to the Google aerial photo of the school a counted 9 bikes (out of a student population of 2,500) in one bike parking location; and I'm not surprised.
Update (San Jose Mercury News): The bicyclist, believed to be 16 years old, was traveling east along East Capitol Expressway around 7:35 a.m. when a white Ford F-150 pick-up going northbound on Silver Creek Road collided with him, Officer Albert Morales said. Emergency personnel performed CPR at the scene and took the injured boy to a local hospital, where he was pronounced dead at 8:10 a.m.
Wednesday, May 8, 2013
Spring into Green at DeAnza College, Cupertino California
 |
| New Terminal at Mineta San Jose International Airport |
The following is some thoughts presented this morning at DeAnza College's Spring into Green event with a panel of other professionals.
Climate Change, Air Pollution, Toxic Roadway Runoff, Oil Depletion, Keystone XL Pipeline, Fracking, and on and on. We would all agree that these are key issues today that need to be addressed. We, dealing with all things environmental agree, that we should be at least technically conversant on these issues but instead of directly discussing these issues I'd like ask you a few questions.
- Who owns the San Jose Airport? (google search)
- Who owns San Jose Diridon Station? (wikipedia)
- Who owns Cupertino city streets?
- Who owns the tracks on which Caltrain and Amtrak run? (Caltrain / Amtrak)
 |
| San Jose Diridon Station |
Yes, Air and Auto. When one entity spends over $1.5 Billion on its infrastructure you will get nice facilities, neatly designed with facilities that are convenient for travellers. But after spending over a billion dollars on a new passenger terminal and a seven story parking garage we still do not have direct transit service to the airport?
When you have a street system that is owned by one government agency competing with passenger rails systems which are prioritized below freight such as corn and cars, which system do you think will get noticed, get used?
Before I continue however, two more questions.
- What year did the Japanese Bullet Train or High Speed Rail begin Operations?
- What year did Japan sign a surrender treaty with the US?
Advocating for Change
In my experience working to advocate for alternative transportation; working for change in our current system, not only has my perspective changed, but my thinking and methods have changed as well. In the 1960's mainly do they War in Vietnam and some well publicized environmental disasters, Americans sought to change the system by a variety of confrontation methods; and they worked for large national issues.
For example Critical Mass was a way for San Franciscans who rode bike to say we matter. However their methods were confrontational with such tactics as secret routes, corking of intersections and confrontations with police.
With the advent of peer based and cyber social systems, change can take place without the confrontation but by learning how to frame you position to sell it to groups of strong opposition, by staging fun community events, incentivizing participants, using digital technologies to break up tasks and allowing for collaboration.
Here are some examples of soft change or in other words "winning hearts and minds":
- Bike Party: This once a month bicycle fiesta on wheels has grown and has brought San Jose some cachet as a hip bike city. There are now "Bike Parties" in most northern and Southern California cities, as well as Baltimore, Boston, Denver, and even in Seoul, Korea and our nations capitol. All based on the San Jose Bike Party model.
- Bag Ban: Using the grown field of "choice architecture" San Jose initiated a ban on free shopping bags, but instead of making it an onerous law with no choice involved, the city prescribes that you pay 10 cents for a bag. In my experience demand for bags has gone done around 97% and with almost no complaints. The program known as "Bring Your Own Bag" has saved not only the cost disposing of the bags but improving the health of our waterways and watersheds as well.
- From Blight to Bright: Governments loved to build things, maintaining them is a whole different thing. Politicians would rather poise for pictures with shovels and scissors than deal with the mundane obligations such as maintenance. General street maintenance along with non-emergency police services are hard to come by. By using the broken window theory we have organized groups of volunteers to go out and clean up blighted areas. Now land owners are starting to take notice and are cleaning up their own properties, improving the community, getting more residents out walking and bicycling.
- Open Data and Civic Hacking: We are currently putting together a group of data nerds who will seek to open transit, municipal budget, and transportation data in a standardized format to allow third parties to develop apps, hardware/appliances, to make it easier to take transit or understand your city. Imagine with an open data standard that you could sit in a pub with an eye on a transit appliance which would display the "next bus" on the wall reducing wait times at transit stops.
- Using carrots and sticks: Getting rid of minimum parking requirements, unbundled parking, bundling transit passes with San Jose Sharks tickets, parking rates based on vehicle weight and size, one way mini car sharing, eco passes, smart phone apps, market based parking, free bike sharing for the first 30 minutes, no validated parking but discounts to pedestrians, cyclists, and transit users, etc.
In none of these instances were technical environmental terms used such as fracking, ozone depletion, or destruction of riparian habitats. Change was incentivizing good choices or fun behaviors that create positive environmental change in the community.
I have listed some video and book resources for you to follow up on.
Thank you.
Additional Resources
Books
Ted Videos
James Kunstler: How bad architecture wrecked cities
Jason Roberts - TedxOu How to Build a Better Block
Chuck Mahron - Tedx1000Lakes - The important difference between a road and a street
Books
- Don't Think of an Elephant - Know your issues and frame the debate - George Lakeoff
- Waiting on a Train: The Embattled Future of Passenger Rail Service--A Year Spent Riding across America - James McCommons
- Straphanger: Saving Our Cities and Ourselves from the Automobile - Taras Grescoe
- The Big Roads: The Untold Story of the Engineers, Visionaries, and Trailblazers Who Created the American Superhighways - Earl Swift
- The Option of Urbanism: Investing in a New American Dream- Christopher Leinberg
- The Death and Life of Great American Cities - Jane Jacobs
- The Economies of Cities - Jane Jacobs
- The Geography of Nowhere: The Rise and Decline of America's Man-Made Landscape - James Howard Kunstler
- Nudge: Improving Decisions about Health, Wealth, and Happiness - Richard Thaler and Cass Sunstein
Ted Videos
James Kunstler: How bad architecture wrecked cities
Jason Roberts - TedxOu How to Build a Better Block
Chuck Mahron - Tedx1000Lakes - The important difference between a road and a street
College Courses
101 Land Use and Development
102 Fundraising
111 Accounting for nonprofits
112 Federal and State Reporting Requirements
121 Financing Public Infrastructure (See Transportation 121)
122 Seminar - Corporate Social Responsibility
101 Intro to Government
102 Intro to City and Municipal Government
103 City Council Rules and Administration
104 Working with City Staff
101 Issue Analysis and Research, and Reporting
102 Public Speaking
103 Social Media
104 News Media
105 Public Relations
106 Reaching out to younger and non-traditional constituents
107 Issue Framing - Not speaking to the choir
101 Public Safety - Police
102 Public Safety - Fire and other Emergency Services
103 Gangs and the community
101 Regulation and Behavioral Economics (The Shopping Bag Lab)
102 Market Based Parking (The High Cost of Free Parking)
103 Fiscalization of Land Use
111 Incentivizing Developers with fees, mandates, and options
112 City and Park Maintenance - Public Private Partnerships
121 Seminar - Big Box vs. Traditional Retail and the return on investment
122 Seminar - Food Trucks, Street Vendors, and Pop-ups and community revitalization
101 Website Administration
102 Front-end Website Administration - Wordpress
103 Front-end Website Administration - Drupal
104 - Back end administration with CiviCRM
111 Open Data and Civic Hacking Lab
101 Issues and Advocacy
102 Community Outreach
103 Issue Campaigning
104 Elected Official Relationship Management
111 Electioneering and Campaigning
112 Legislative and Political Analysis (City, Region and State Level)
101 Roberts Rules of Order
102 Board Administration
103 Corporate and Board Governance
104 Non-Profit Administration
111 Regional Public Administration
112 Membership Management and Engagement
121 Public Accounting and Budgeting
122 Taxation - Property, Sales, Income and Fees
101 Event Management and Accounting
102 Sponsorship Management and Negotiation
103 Event Promotion and Partnerships
104 Volunteer Coordination
101 The New City and Multimodal Systems
111 Public and Private Transit and Mobile Applications
121 Financing Public Infrastructure
101 Placemaking
102 Complete Streets
111 Basic Real Estate Development
112 The Sharing Economy - Car, bike, office, and tool share
121 Traditional Real Estate Development and Business Districts
122 Transporatation Hub Development
Thursday, May 2, 2013
What goes up must come down or have the chickens finally coming home to roost?
For curses are like arrows
San Jose Mayor
Louis S. Solari
July 1958 - June 1960
shot upright, which falling
down light on the suters
[shooters] head.

The Lamentable and True Tragedy of Arden of Feversham - 1592
Today's Roadshow column in the San Jose Mercury News led with the headline: "San Jose pothole blamed on Reed, Brown, and Pruius drivers". Well, for those of you from out of state, Reed is San Jose Mayor Chuck Reed, and Brown is California Governor Jerry Brown.
San Jose resident Joe Coughlin writes to Mr. Roadshow Gary Richards:
"Mayor Chuck Reed should be ashamed of the job he is doing regarding road repair. And we all ought to be embarrassed. We are not only the worst in California, we are the worst in the NATION."
I find this readers rant somewhat timely given that the evening before I attended the city's Planning Commission meeting. On the agenda was a study session to review the city's capital budget five-year plan. One set of figures that shocked me a bit (and after seeing these numbers for a few years I don't get shocked that easily) was the total infrastructure backlog reported at $909 million. Given that this year the city budget is $2.6 billion about 35% of the cities annual budget is represented by infrastructure backlog. Of the cities $909 million in infrastructure backlog $460 million is for transportation backlog, or just over 50%. Of that $460 million, $303 million is needed just to maintain the roadways back to normal levels.
 |
| Population estimates used to sell large infrastructure building progam in San Jose in the early 60's |
These mayors, and many other post-war U.S. mayors set us up with a new blueprint for the design of cities that pushed cities and their boundaries outward in a rush to annex tax generating development. In those days, it appeared that as soon as a new development was built, Dutch Hamann was out to annex it; One example routinely given is the Valley Fair shopping center. Leonard McKay told it so well in a series of two blog posts in 2006. (Dutch Hamann Part I and Part II)
 |
| Photo: wikipedia (San Jose) |
"At that time, a sales tax was a major generator of revenue, and with the council’s approval, a program of strip annexation was set in motion. Hamann determined where future shopping centers were likely to be located, and then the city proceeded to annex a narrow band of land out along each major road and intersection, thus ensuring that the sales tax revenue would come to San Jose.
Along Stevens Creek Road to Cupertino, Bascom Boulevard, North First Street, and Monterey Highway to Morgan Hill—each and every area was annexed. Prior to Hamann’s tenure—more than 100 years—only 46 annexations occurred. During his 19 years, 1,377 annexations were effected"
If you've ever looked a map of Paris it looks by its very shape, its very design that it would be easy and relatively inexpensive to administer and maintain. Compare that with a map of San Jose (shown above) and
 you ask yourself, how do you effectively police a city like this, maintain the roadway system or run an efficient library or parks system? In many areas of the city that fully enclose unincorporated county areas it even becomes more puzzling. Now try to figure out how you administer an effective police force, sanitary sewer systems, roads, streetlights, schools and water systems.

Yes it is extremely complicated. Just ask anyone living in the Burbank section of San Jose, an area where most neighbhors don't know who administers (county or city) parts of their own neighborhood.
Actually the layout of the city used to be worse. That is why 40 years ago the California State legislature created a regulatory vehicle to control crazy city boundaries that were confusing even city officials. Known by their acronym LAFCO (Local Agency Formation Commission), these independent regulatory commissions where created to control the boundaries of cities and most special districts (such as utility, school, sewage, vector, etc.). But more on that in a later post.
Given this willy nilly style of development and city leaders gross over-projection of population growth (see graph) infrastructure building (construction) was the real growth industry when an Apple in this valley was still something you ate. Even though California, the Bay Area, and San Jose grew at astonishing rates in the 1960's, 70's, and 80's their projections show that in 2010 San Jose's population would be at 1.8 million residents. In 2010 the city population was only 952,612 per the United States Census Bureau, or just over half what was projected.
To accommodate this overly inflated growth rate, the city built new sewer systems and water treatment plants (the current plant in Alviso), realigned roadways (Nagle Taylor, Julian and the Alameda), widened streets to nowhere (Park Ave., Minnesota at Meridian), built new railway under crossings (Park Ave. near Diridon), and new satellite libraries (West Valley branch etc. which was rebuilt several years ago), and fire stations.
What these leaders failed to realize was that the future money needed to maintain all this growing infrastructure base could not be recouped by the low yields (nowadays we call this sustainable) on a tax base reflected in the form of bedroom communities and urban sprawl. Many of these projects would not pencil out, or pay for themselves; and this was before Californians (not Mayor Reed or Jerry Brown) decided to severely restrict cities ability to maintain it all by passing Proposition 13 in 1978. So since 1978 cities have had to become very creative to tax these essentials of suburban living; investments in sewer pipe, pumping stations, wide Almaden neighborhood streets, or cul-du-sac living of the Evergreen area.
These leaders threw away the old tried and traditional rules of building cites and went on to build over 4,000 miles of municipal roadways. Now the potholes are coming home to roost (oh well I tried), or the archers arrow has returned to earth only to strike the shooter in the head.
As I have mentioned in many a post we, and many other California cities were built in the postwar era without a thought to how we would maintain these roadways. We have $303 million in unfunded road backlogs. We need around $100 million per year to maintain the system. We have no room in the general budget for repair. What funds are used to fix potholes, at about $16 million per year come from federal and state sources. We are now starting to receive the benefits of the recently enacted $10 vehicle fee but these amounts are nowhere near enough to cover the repair and maintenance of our roadways. State and federal gasoline taxes do not directly finance our maintenance program. Those funds are for building and maintaining the federal and state highway systems.
Yes we do have a huge pothole problem, a problem that many has grown immensely in the last few years. However until residents and motorist realize how complex, how expensive, and how poorly funded our roadway system is, the problem is just not going to get any better anytime soon.
The chickens have come home to roost.
Yes we do have a huge pothole problem, a problem that many has grown immensely in the last few years. However until residents and motorist realize how complex, how expensive, and how poorly funded our roadway system is, the problem is just not going to get any better anytime soon.
The chickens have come home to roost.
Monday, April 29, 2013
Creating a nonprofit to enhance profits. Or is this road paved with good intentions?
 |
| Everybody wants good roads but paying for them is a whole other story. |
In a San Jose Mercury News column written by Gary Richards titled Mr. Roadshow, a reader asks after describing the conditions of local roads and the abundance of potholes:
Mr. Roadshow responds quoting "a nonprofit group known as The Road Information Project (TRIP)" that the additional vehicle operating costs due to road conditions in San Jose are the highest in the nation (TRIP's Urban Road Report 9/22/2010). This may be so, but what he fails to clarify is that TRIP (and it's California affiliate, Transportation California), although a non-profit, is organized to enhance the business growth of its member companies which build and maintain transportation infrastructure (also known as roads, highways, bridges, and tunnels). There is a reason they are located in Washington D.C. (and Sacramento), and that is to influence federal and state construction funds and transportation financing to benefit their companies."I'm wondering. Has anyone looked into what that ends up costing all drivers in added maintenance costs?"
Now there is nothing wrong with that (influencing public opinion to benefit the construction industry). But to give readers a false sense of security that they are some altruist nonprofit tasked with providing Americans with the complete picture on transportation, confuses readers, many of which have no idea how our roads are built, maintained and financed.
The board of directors of TRIP reads like a who's who of the construction industry (and you have to be a company to join, no individuals please) but this is no different than the California Transportation Commission that (outside of Carl Guardino, CEO of the Silicon Valley Learderhip Group representing the tech industry) has its fair share of commissioners from the real estate development and construction industry.
For the last 60 years, since the construction of the federal interstate system, we have built a transportation system that relies exclusively on automobile travel and consisted of large and expensive infrastructure projects. Now the maintenance bill is coming due and our information is coming from the very industry that stands to profit from it. Mr. Roadshow, all I am asking is that we balance this view with other voices.We should be more transparent in the future when a "nonprofit" issues reports which will bolster their bottom line long before it will improve our lives.
Thank you.
For more on the current status of California Roads see my series "Road's Cost"
TRIP Urban Road Report 9/22/2010
Appendix A
Appendix B
Appendix C
Appendix D
Monday, March 25, 2013
Good roads or good jobs?

The fear is that Samsung will take its R&D proposal and move to Austin where they will, according to city officials offer even greater financial incentives. But Texas officials already have a track history of huge giveaways to large corporations. According to a database of state incentive packages published on the New York Times website Austin has already granted Samsung alone $232 million, through the Texas Enterprise Fund, the Tax Refund for Economic Development, and Texas' Chapter 313/Economic Development Act.
So in preparation for tomorrows meeting I have included a link to a great series of articles written by Louise Story, an investigative journalist for the New York Times. The series is titled "United States of Subsidies" and examines business incentives and their impact on jobs and local economies.
Here is a radio interview with Louise on Fresh Air with Terry Gross.
Sunday, March 10, 2013
Gronigen - Holland's cycling city
 |
| photo:bugbog.com |
In Groningen, the Netherlands’sixth largest city, the main form of transport is the bicycle. The city is famous for having the highest percentage of bicycle usage in the world. How has Groningen done it? Cycling here, and indeed in much of the Netherlands, is just the norm. The success comes from a series of sound policies which view cycling as an integral part of urban renewal, planning and transport strategy. By providing proper infrastructure and amenities cycling has blossomed over time and today the main 46 routes of the cycling network is used daily by 216,000 citizens. By prioritising and promoting cycling as the main mode of transportation, city planners, local authorities and cycling advocates have played an important part in the city’s reputation as a great place to live. Groningen has a relatively young population of approximately 180,000 inhabitants, which account for a large proportion of the city bikers, but people of all ages opting for two wheels over four. And this is a growing trend. Research by Groningen municipality in 2008 showed a considerable growth of cycling in the last years: an average of 1.4 bicycle trips per person per day in the city, making up more than 50% of the total journeys, a growth of 9% from 2007. In order to further understand the success of the bicycle in Groningen, it is important to look at how urban design and policies have changed over time to make it the leading cycle city we see today.
“Cycling is viewed as an integral part of urban renewal, planning and transport strategy”
History of Carfree Development
Importance of policy
The city treats cyclists with respect. A series of sound transportation policies and investments has maintained a carfree urban space – favouring walking, public transport and predominantly cycling. This has resulted in a major trend away from car-use to bike-use in the city of Groningen. Between 1989 and 2000, € 23 million was invested in cycling infrastructure and the annual amount con-tinues to grow. Investments have also been made to expand the network of cycling lanes, improve the pavements, build bridges for cyclists, and many more bike parking facilities – making cycling faster and more convenient. As cycling is the lifeblood of the city, it has been given adequate space and time to flow safely and efficiently.
During the 1980s and 1990s a car parking policy was strictly implemented. Car parking with time restrictions was introduced in a broad radius around the inner city. Park and Ride areas were created combined with city buses and other high quality public transport. But overall, cycling policy has been central to the traffic plans, which in contrast, car accessibility has been restricted within the city centre.Reaping the Rewards over a long period of time local authorities have made clear choices, however manifold criticised. Traffic circulation plans were based on the concentration of motorised traffic into a limited road space on the outskirts of the city, and developing a very coherent, comfortable and dense cycle network. This is the result of a clear vision of urban development – based on the idea that a city is for its people. Groningen is a compact city, and for now at least, continues to stay this way. For example, newly built neighbourhoods are no more than 6 km from the city centre. Groningen municipality research showed in 2008 78% of residents and 90% of employees now live within 3 km of the city centre. Residential areas are developed with good connections to the city centre and green lungs in between. There are entire housing developments built along major bicycle and scooter “roadways”, massive bike parks everywhere, many roads that are one way for cars but two way for bikes, and special signal phases for bikes.
Groningen in Numbers
Population: 180,000 inhabitants
Size of Groningen: 87 square kilometres
Residents Traveling by Bike: 57%
Average cycling trips each day: 1.4 per person
Number of cycling routes in Groningen: 46
Number using cycling routes each day: 216,000
There are some interesting economic repercussions to come out of replacing space for cars with greenery, pedestrianisation, cycleways and bus lanes. Banning car traffic has boosted jobs and business. Groningen’s economic development has improved, particularly for businesses which were once in revolt against car restraint, but now are clamouring for more of it. The main function of the inner city has become a successful mix of living, working and shopping.
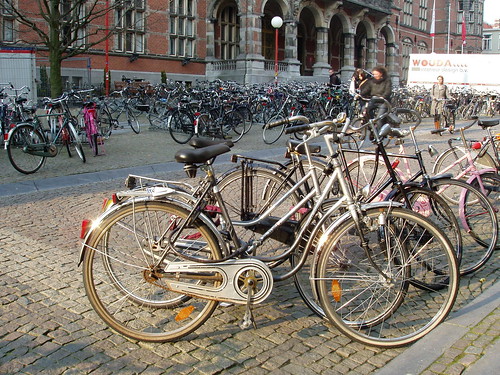 Cycling into the Future Groningen undoubtedly leads the way in the “cyclisation”of European cities, but many others are putting two wheels in motion to follow its example. However, no other European city can match Groningen’s record, where 57% of all trips around the city are on bikes, but in quite a few cities the ratio is rising to a third or more.The impressive high rate of cycling in Groningen can be explained best by consistent urban development and transportation policies based on reclaiming inner city space from cars, making it into a living room for its people. This spatial concept of city development has undoubtedly been rooted in the clear political vision of the Social Democrats for several decades. Such legislative commitments do seem to be the key in getting citizens to kick the car habit. Apart from a political vision, many other actors involved in making Groningen the “World’s Cycling City”cannot be ignored – the cyclists themselves. In a nutshell, the success of cycling in Groningen can be explained as a result of a strong vision for a liveable city for its people. For more information, please visit: http://www.cyclinginfo.nl/ and http://www.fietsberaad.nl/
Photo courtesy of http://www.flickr.com/photos/truusbobjantoo/2404090966/The centre of the city was to be considered as the ‘living room’for its people”
Saturday, March 2, 2013
That's a big piece of pie

 |
| Necessary road expenditures total over 10% of the general budget |
Projected General Fund Expenditures / Incremental General Fund Surplus/(Shortfall) / City General Fund Retirement Contribution Costs (San Jose Mercury News)
2013-14 $858.2 million / ($5.5 million) / $275.8 million
2014-15 $893.1 million / ($13.7 million) / $295.1 million
2015-16 $916.8 million / $2 million / $301.6 million
2016-17 $952.4 million / ($4.7 million) / $312.6 million
2017-18 $991.2 million / ($6 million) / $329.6 million
I've added the the $100 million in deferred maintenance the city needs to spend just to get the city's 2,000 plus miles of roadways back to normal to highlight just how much of the city's general fund this represents (See: "There's no more change in the sofa - Fixing San Jose's Roads").
Anyway you look at it, its a big piece of pie.

Subscribe to:
Posts (Atom)


