Tomorrow, the San Jose City Council will consider "an agreement" between the city and Samsung Semiconductor to allow for up to $7 million in incentives. As many of you know I have been writing a series of posts describing California cities desperate attempt just to keep their roads maintained. San Jose needs to spend $100 million each year over the next 10 years just to maintain the current level of road quality, but in the last few years the city has roughly averaged about $5 to $ 10 million from the general fund to maintain our roadways. So one way to look at the incentive package proposed for Samsung is about the same that the city commits to road repair each year, or about 10% of what is needed.
The fear is that Samsung will take its R&D proposal and move to Austin where they will, according to city officials offer even greater financial incentives. But Texas officials already have a track history of huge giveaways to large corporations. According to a database of state incentive packages published on the New York Times website Austin has already granted Samsung alone $232 million, through the Texas Enterprise Fund, the Tax Refund for Economic Development, and Texas' Chapter 313/Economic Development Act.
So in preparation for tomorrows meeting I have included a link to a great series of articles written by Louise Story, an investigative journalist for the New York Times. The series is titled "United States of Subsidies" and examines business incentives and their impact on jobs and local economies.
Here is a radio interview with Louise on Fresh Air with Terry Gross.
Monday, March 25, 2013
Sunday, March 10, 2013
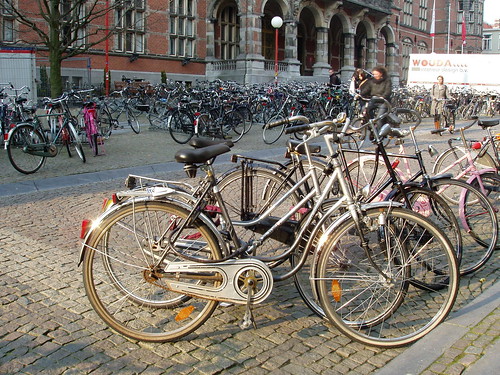
Gronigen - Holland's cycling city
![]() |
| photo:bugbog.com |
In Groningen, the Netherlands’sixth largest city, the main form of transport is the bicycle. The city is famous for having the highest percentage of bicycle usage in the world. How has Groningen done it? Cycling here, and indeed in much of the Netherlands, is just the norm. The success comes from a series of sound policies which view cycling as an integral part of urban renewal, planning and transport strategy. By providing proper infrastructure and amenities cycling has blossomed over time and today the main 46 routes of the cycling network is used daily by 216,000 citizens. By prioritising and promoting cycling as the main mode of transportation, city planners, local authorities and cycling advocates have played an important part in the city’s reputation as a great place to live. Groningen has a relatively young population of approximately 180,000 inhabitants, which account for a large proportion of the city bikers, but people of all ages opting for two wheels over four. And this is a growing trend. Research by Groningen municipality in 2008 showed a considerable growth of cycling in the last years: an average of 1.4 bicycle trips per person per day in the city, making up more than 50% of the total journeys, a growth of 9% from 2007. In order to further understand the success of the bicycle in Groningen, it is important to look at how urban design and policies have changed over time to make it the leading cycle city we see today.
“Cycling is viewed as an integral part of urban renewal, planning and transport strategy”
History of Carfree Development
Importance of policy
The city treats cyclists with respect. A series of sound transportation policies and investments has maintained a carfree urban space – favouring walking, public transport and predominantly cycling. This has resulted in a major trend away from car-use to bike-use in the city of Groningen. Between 1989 and 2000, € 23 million was invested in cycling infrastructure and the annual amount con-tinues to grow. Investments have also been made to expand the network of cycling lanes, improve the pavements, build bridges for cyclists, and many more bike parking facilities – making cycling faster and more convenient. As cycling is the lifeblood of the city, it has been given adequate space and time to flow safely and efficiently.
During the 1980s and 1990s a car parking policy was strictly implemented. Car parking with time restrictions was introduced in a broad radius around the inner city. Park and Ride areas were created combined with city buses and other high quality public transport. But overall, cycling policy has been central to the traffic plans, which in contrast, car accessibility has been restricted within the city centre.Reaping the Rewards over a long period of time local authorities have made clear choices, however manifold criticised. Traffic circulation plans were based on the concentration of motorised traffic into a limited road space on the outskirts of the city, and developing a very coherent, comfortable and dense cycle network. This is the result of a clear vision of urban development – based on the idea that a city is for its people. Groningen is a compact city, and for now at least, continues to stay this way. For example, newly built neighbourhoods are no more than 6 km from the city centre. Groningen municipality research showed in 2008 78% of residents and 90% of employees now live within 3 km of the city centre. Residential areas are developed with good connections to the city centre and green lungs in between. There are entire housing developments built along major bicycle and scooter “roadways”, massive bike parks everywhere, many roads that are one way for cars but two way for bikes, and special signal phases for bikes.
Groningen in Numbers
Population: 180,000 inhabitants
Size of Groningen: 87 square kilometres
Residents Traveling by Bike: 57%
Average cycling trips each day: 1.4 per person
Number of cycling routes in Groningen: 46
Number using cycling routes each day: 216,000
There are some interesting economic repercussions to come out of replacing space for cars with greenery, pedestrianisation, cycleways and bus lanes. Banning car traffic has boosted jobs and business. Groningen’s economic development has improved, particularly for businesses which were once in revolt against car restraint, but now are clamouring for more of it. The main function of the inner city has become a successful mix of living, working and shopping.
Cycling into the Future Groningen undoubtedly leads the way in the “cyclisation”of European cities, but many others are putting two wheels in motion to follow its example. However, no other European city can match Groningen’s record, where 57% of all trips around the city are on bikes, but in quite a few cities the ratio is rising to a third or more.The impressive high rate of cycling in Groningen can be explained best by consistent urban development and transportation policies based on reclaiming inner city space from cars, making it into a living room for its people. This spatial concept of city development has undoubtedly been rooted in the clear political vision of the Social Democrats for several decades. Such legislative commitments do seem to be the key in getting citizens to kick the car habit. Apart from a political vision, many other actors involved in making Groningen the “World’s Cycling City”cannot be ignored – the cyclists themselves. In a nutshell, the success of cycling in Groningen can be explained as a result of a strong vision for a liveable city for its people. For more information, please visit: http://www.cyclinginfo.nl/ and http://www.fietsberaad.nl/Photo courtesy of http://www.flickr.com/photos/truusbobjantoo/2404090966/The centre of the city was to be considered as the ‘living room’for its people”
Labels:
bicycle,
bike culture,
Wonk Free
Location:
Groningen, The Netherlands
Saturday, March 2, 2013
That's a big piece of pie
Amongst the headlines in this mornings local newspaper about the five felony counts thrown at disgraced former County Supervisor George Shirakawa ("DA:Supervisor George Shirakawa deceived public for years, had a secret slush fund"), I spied an article written by John Wolfolk ("San Jose' officials propose $11 million in raises") highlighting easing San Jose city budget shortfalls due to recovering revenues and gains from previous austerity measures.
In the article was the following table:
Projected General Fund Expenditures / Incremental General Fund Surplus/(Shortfall) / City General Fund Retirement Contribution Costs (San Jose Mercury News)
2013-14 $858.2 million / ($5.5 million) / $275.8 million
2014-15 $893.1 million / ($13.7 million) / $295.1 million
2015-16 $916.8 million / $2 million / $301.6 million
2016-17 $952.4 million / ($4.7 million) / $312.6 million
2017-18 $991.2 million / ($6 million) / $329.6 million
I've added the the $100 million in deferred maintenance the city needs to spend just to get the city's 2,000 plus miles of roadways back to normal to highlight just how much of the city's general fund this represents (See: "There's no more change in the sofa - Fixing San Jose's Roads").
Anyway you look at it, its a big piece of pie.
![]() |
| Necessary road expenditures total over 10% of the general budget |
Projected General Fund Expenditures / Incremental General Fund Surplus/(Shortfall) / City General Fund Retirement Contribution Costs (San Jose Mercury News)
2013-14 $858.2 million / ($5.5 million) / $275.8 million
2014-15 $893.1 million / ($13.7 million) / $295.1 million
2015-16 $916.8 million / $2 million / $301.6 million
2016-17 $952.4 million / ($4.7 million) / $312.6 million
2017-18 $991.2 million / ($6 million) / $329.6 million
I've added the the $100 million in deferred maintenance the city needs to spend just to get the city's 2,000 plus miles of roadways back to normal to highlight just how much of the city's general fund this represents (See: "There's no more change in the sofa - Fixing San Jose's Roads").
Anyway you look at it, its a big piece of pie.
Subscribe to:
Posts (Atom)