Sunday, March 10, 2013

Gronigen - Holland's cycling city

photo:bugbog.com
This article is a repost from my friends over at the World Carfree Network. The article was written by by Ton Daggers and Jane Harding.

In Groningen, the Netherlands’sixth largest city, the main form of transport is the bicycle. The city is famous for having the highest percentage of bicycle usage in the world. How has Groningen done it? Cycling here, and indeed in much of the Netherlands, is just the norm. The success comes from a series of sound policies which view cycling as an integral part of urban renewal, planning and transport strategy. By providing proper infrastructure and amenities cycling has blossomed over time and today the main 46 routes of the cycling network is used daily by 216,000 citizens. By prioritising and promoting cycling as the main mode of transportation, city planners, local authorities and cycling advocates have played an important part in the city’s reputation as a great place to live. Groningen has a relatively young population of approximately 180,000 inhabitants, which account for a large proportion of the city bikers, but people of all ages opting for two wheels over four. And this is a growing trend. Research by Groningen municipality in 2008 showed a considerable growth of cycling in the last years: an average of 1.4 bicycle trips per person per day in the city, making up more than 50% of the total journeys, a growth of 9% from 2007. In order to further understand the success of the bicycle in Groningen, it is important to look at how urban design and policies have changed over time to make it the leading cycle city we see today.

“Cycling is viewed as an integral part of urban renewal, planning and transport strategy”
History of Carfree Development
The city has a long history of urban developments which have maintained the value of keeping the inner city as a central point for a host of activities: a blend of living, working and shopping which favours pedestrians, cyclists and public transportation over the car. Since the 1960s the municipality has been way ahead in its traffic plans and spatial planning policies; maintaining a vision of a “compact city”and implementing policies which have led to a carfree city centre, with almost all areas easily reachable by bicycle. However, the path has not always been easy.  During the 1950s and 1960s most cities and towns in the Netherlands were making room for vehicles – some even removed bicycle paths in order to free up space for the car.  In Groningen, motorisation was growing rapidly and so was suburban sprawl – there were no restrictions for cars driving through and very few cycle routes leading to the centre. The motorist was king at this time.In 1972, local authorities changed the emphasis of urban planning and development in Groningen.  The centre of the city was to be considered as the “living room”for its people. The basic concept used in urban planning was based on the “compact city”vision, which placed an integrated transport system high on the agenda – for an inner city favouring a combined use of pedestrians, cyclists, buses and other means of public transport. A traffic circulation plan divided the inner city into four sections and a ring road was built, encircling the city and reducing access to the centre by car. The result was an inner city which is entirely closed off to cars, and only possible to travel between sectors by walking, bicycling or using public transport. What has further spurred the use of bicycles over all other sustainable transportation is the huge expansion of the cycle network – there are many traffic free bike lanes from the outskirts to the city centre – making cycling is the most viable mode of transport for most journeys.

Importance of policy
The city treats cyclists with respect. A series of sound transportation policies and investments has maintained a carfree urban space – favouring walking, public transport and predominantly cycling. This has resulted in a major trend away from car-use to bike-use in the city of Groningen. Between 1989 and 2000, € 23 million was invested in cycling infrastructure and the annual amount con-tinues to grow. Investments have also been made to expand the network of cycling lanes, improve the pavements, build bridges for cyclists, and many more bike parking facilities – making cycling faster and more convenient. As cycling is the lifeblood of the city, it has been given adequate space and time to flow safely and efficiently.

During the 1980s and 1990s a car parking policy was strictly implemented. Car parking with time restrictions was introduced in a broad radius around the inner city. Park and Ride areas were created combined with city buses and other high quality public transport. But overall, cycling policy has been central to the traffic plans, which in contrast, car accessibility has been restricted within the city centre.Reaping the Rewards over a long period of time local authorities have made clear choices, however manifold criticised. Traffic circulation plans were based on the concentration of motorised traffic into a limited road space on the outskirts of the city, and developing a very coherent, comfortable and dense cycle network. This is the result of a clear vision of urban development – based on the idea that a city is for its people. Groningen is a compact city, and for now at least, continues to stay this way. For example, newly built neighbourhoods are no more than 6 km from the city centre. Groningen municipality research showed in 2008 78% of residents and 90% of employees now live within 3 km of the city centre. Residential areas are developed with good connections to the city centre and green lungs in between. There are entire housing developments built along major bicycle and scooter “roadways”, massive bike parks everywhere, many roads that are one way for cars but two way for bikes, and special signal phases for bikes.


Groningen in Numbers
Population: 180,000 inhabitants
Size of Groningen: 87 square kilometres
Residents Traveling by Bike: 57%
Average cycling trips each day: 1.4 per person
Number of cycling routes in Groningen: 46
Number using cycling routes each day: 216,000


There are some interesting economic repercussions to come out of replacing space for cars with greenery, pedestrianisation, cycleways and bus lanes. Banning car traffic has boosted jobs and business. Groningen’s economic development has improved, particularly for businesses which were once in revolt against car restraint, but now are clamouring for more of it. The main function of the inner city has become a successful mix of living, working and shopping.
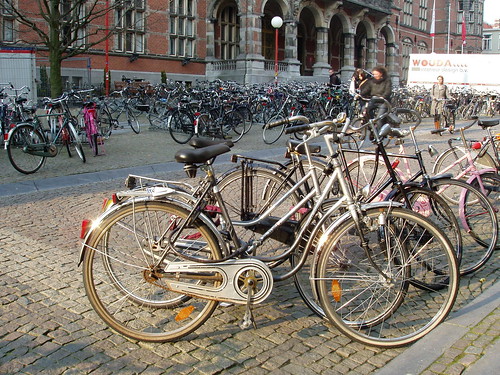
Cycling into the Future Groningen undoubtedly leads the way in the “cyclisation”of European cities, but many others are putting two wheels in motion to follow its example. However, no other European city can match Groningen’s record, where 57% of all trips around the city are on bikes, but in quite a few cities the ratio is rising to a third or more.The impressive high rate of cycling in Groningen can be explained best by consistent urban development and transportation policies based on reclaiming inner city space from cars, making it into a living room for its people. This spatial concept of city development has undoubtedly been rooted in the clear political vision of the Social Democrats for several decades. Such legislative commitments do seem to be the key in getting citizens to kick the car habit. Apart from a political vision, many other actors involved in making Groningen the “World’s Cycling City”cannot be ignored – the cyclists themselves. In a nutshell, the success of cycling in Groningen can be explained as a result of a strong vision for a liveable city for its people.  For more information, please visit: http://www.cyclinginfo.nl/ and http://www.fietsberaad.nl/
The centre of the city was to be considered as the ‘living room’for its people”
Photo courtesy of  http://www.flickr.com/photos/truusbobjantoo/2404090966/

Saturday, March 2, 2013

That's a big piece of pie

Amongst the headlines in this mornings local newspaper about the five felony counts thrown at disgraced former County Supervisor George Shirakawa ("DA:Supervisor George Shirakawa deceived public for years, had a secret slush fund"), I spied an article written by John Wolfolk ("San Jose' officials propose $11 million in raises") highlighting easing San Jose city budget shortfalls due to recovering revenues and gains from previous austerity measures.


Necessary road expenditures
total over 10% of the general budget
 In the article was the following table:

Projected General Fund Expenditures / Incremental General Fund Surplus/(Shortfall) / City General Fund Retirement Contribution Costs (San Jose Mercury News)
2013-14 $858.2 million / ($5.5 million) / $275.8 million
2014-15 $893.1 million / ($13.7 million) / $295.1 million
2015-16 $916.8 million / $2 million / $301.6 million
2016-17 $952.4 million / ($4.7 million) / $312.6 million
2017-18 $991.2 million / ($6 million) / $329.6 million

I've added the the $100 million in deferred maintenance the city needs to spend just to get the city's 2,000 plus miles of roadways back to normal to highlight just how much of the city's general fund this represents (See: "There's no more change in the sofa - Fixing San Jose's Roads").

Anyway you look at it, its a big piece of pie.


Thursday, February 28, 2013

A solar system in search of a sun - decentralization has its costs


photo:Destination:Freedom
 Most readers of this blog may know of my involvement with trains. While a student in Japan, I had used local trolleys, commuter and express trains, and even have considerable experience with their "bullet trains". Travelling throughout Europe, I have travelled to and within thirteen countries by train.

Here locally in addition to the Caltrain and Bart systems, I have also used long distance Amtrak trains as well. I have chaired  a Caltrain committee and have participated in the process of developing station (rail) plans. Recently while browsing Caltrans (Caltrans administers Amtrak California) I came across the draft of a new California State Rail Plan. I was surprised to learn that the public open house meetings to comment on the plan was taking place only during the month February of this year.

When I check the locations of the meetings these are the cities that were listed:
  • Sacramento
  • Oakland
  • San Diego
  • Los Angeles
  • Fresno
  • and an online webinar
Except for Sacramento (the state capitol) they were all the home of a Caltrans district offices and the venues were either in Caltrans offices and state office buildings.

This got me to thinking. If San Jose is the third largest city in California, the future home of the "largest train station west of the Mississippi" (during station plan meetings city planning staff often repeated this phrase), and a future high speed rail station,  how did we get passed up by places like Fresno, Sacramento, and Oakland?

One reason comes to mind. When it comes to San Jose, and especially downtown San Jose; the city is a government, corporate, agency, and non-profit leadership backwater. Every city on the list for the rail plan open house is the home to some type of California state district office. San Jose has none. It was only recently that the city even got additional representation on the Metropolitan Transportation Commission (MTC is the regional transportation funding authority) board to match the growth in population.

To develop a more vibrant downtown, yes you need to have housing, jobs, retail, and entertainment. But to truly be a central part of a major city you need to be a nexus, a hub, a network; were leaders, administrators, legislators, media outlets, judicial bodies, doers, thinkers, creators, and innovators all come together; face to face; and not just on Skype.

If you look at the downtown area it is absent many of these institutions. Yes the city brought back city hall to downtown San Jose after a long absence, and yes San Jose State University never left, and yes thanks to the Silicon Valley Leadership Group's muscle the U.S. Patent office has relocated for the first time an office outside of Washington D.C.; although in a much vacant city hall.

Absent are governmental organizations that in most cities are located in a downtown core. Santa Clara County headquarters left downtown long ago, as did the city's largest newspaper, and the NBC affiliate vacated several years ago. The state office building is a depressing two-story concrete bunker that houses only a few offices. Likewise the federal building is only five stories hosting mainly a immigration office. Above the city level, no elected official has an office in downtown San Jose (see map below).

Likewise agencies, such as the Santa Clara Valley Water District and the Santa Clara County Open Space Authority are located in the sprawling suburbs to the south. The San Jose Water District and VTA (both the regional transportation authority and transit provider) moved out to the northern suburbs. Many nonprofit institutions like the United Way and YMCA, and even the Silicon Valley Leadership Group also mange their affairs from outside the downtown area.

If San Jose truly wants to be "the Capitol of the Silicon Valley", to make their city a more vibrant, lively, and more enriching city it should start to woo these institutions, these leaders to this corner of the world. The city would benefit greatly to have a central place for leaders and ideas.

In my train example, if more locals could have provided input to a rail plan as residents of a city with the largest train station west of the Mississippi, we could be on our path to a true transportation hub as well as a modern technological center.

Partial listing of goverment and agency offices in the Bay Area


View San Jose Administration in a larger map


Govermental Admistrative Resources in Bay Area Cities

San Francisco
Federal Offices

Centers for Medicare & Medicaid Services
Office of the Regional Administrator
90 7th Street, Suite 5-300

Department of Commerce
San Francisco Regional Office of Fair Housing and Equal Opportunity
600 Harrison Street, 3rd Floor

Department of Education
San Francisco Regional Office
50 Beale Street, room 9700 Department of Health and Human Services (HHS) San Francisco Regional Office 90 Seventh Street, Suite 5-100

Department of Housing and Urban Development (HUD)
San Francisco Regional Office of Fair Housing and Equal Opportunity
600 Harrison Street, 3rd Floor

Department of Justice United States Attorney’s
Office for the Northern District of California
Federal Courthouse, 11th Floor 450 Golden Gate Avenue

Department of Labor
San Francisco Regional Office
90 – 7th Street, Suite 17-300

Department of State
San Francisco Regional Passport Agency
95th Hawthorne Street, 5th Floor

Equal Employment Opportunity Commission (EEOC)
San Francisco District Office
350 The Embarcadero, Suite 500

Federal Bureau of Investigation (FBI) FBI – San Francisco
450 Golden Gate Avenue, 12th Floor

Internal Revenue Service (IRS)
San Francisco Local Office
450 Golden Gate Ave.

International Trade Administration
 250 Montgomery Street

Minority Business Development Agency (MBDA)
San Francisco National Enterprise Center
221 Main Street, Room 1280

National Archives and Records Administration (NARA)
The National Archives at San Francisco
1000 Commodore Drive

Federal Deposit Insurance Corporation
25 Jessie Street at Ecker Square, Suite 2300

Federal Reserve Bank 12th District
101 Market Street, San Francisco, CA 94105

U.S. Mint 155 Hermann St

National Labor Relations Board
901 Market St., Suite 400

U.S. Federal Aviation Administration
603 San Francisco International Airport

San Francisco Federal Building
90 7th Street
This 18-story building also houses numerous federal offices

State
Hiram Johnson State Office Building
455 Golden Gate Avenue
This 14-story office building houses numerous Californi state offices

Regional
Bay Area Air Quality Management District
939 Ellis St.

Oakland
Federal
National Park Service
One Jackson Center 1111 Jackson Street, Suite 700

Department of Veterans Affairs (VA)
Oakland Regional Office
Oakland Federal Building, North Tower 1301 Clay Street, 12th

State

Elihu M . Harris State of California Office Building
1501–1533 Clay Street
This 22 story state office building houses numerous state offices.

University of California
Office of the President
1111 Franklin Street
Caltrans
District 4
111 Grand Ave


Regional

MTC and Bay Area Bridge and Toll Authority
MetroCenter
101 Eighth Street
Bay Area Rapid Transit
Kaiser Center 20th Street Mall, Third Floor, 344 20th St.


San Carlos (San Mateo County)

Caltrain and Samtrans
1250 San Carlos Ave.


San Jose

Federal
U.S. Patent Office
200 E. Santa Clara Ave.
Established in 2012

United States Federal Office Building
280 South First Street
This 5 story office building  houses a limited number of federal offices


State
California State Office Building
100 Paseo de San Antonio
This 2 story building houses a limited number of state offices such as the State Board of Equalization

Tuesday, February 26, 2013

Parks from a Manhattan perspective

Justin Davidson  is a classical music and architecture critic for New York Magazine. I thought I would share a New York version of parks and open space given the limitations or advantages of designing in a dense urban setting. Notice the attention to detail. The quality of the park features.

How would you like to see your own parks? Enjoy!


Monday, February 25, 2013

Downtown San Jose builds new parklets in the Central Business District

Work has begun on a new
downtown parket.
This morning I had a chance to witness a new parklet being constructed on San Fernando St. in downtown San Jose in front of Azucar restaurant.  The expanded sidewalk will allow for outdoor dining just in time for Spring.

What's nice is that dinners will not be subject to car fumes and noise due to the planed bike corridor on San Fernando from Diridon Station to city hall.

Show some thanks to your elected city officials and the Department of Transportation for the improvements being made downtown, by stopping to dine downtown. Council member Sam Liccardo's district includes the downtown area.


View Larger Map

Friday, February 15, 2013

Video: Michael Freedman speaks on revitalizing strip commerical districts

Willow Glen Town Square, an
FTS project completed 2012
Michael Freedman’s of Freedman, Tung, and Sasaki (FTS) gave a great presentation on June 20, 2009 focused on what makes a “Grand Boulevard” and how each jurisdiction in the region (San Mateo and Santa Clara counties in the San Francisco Bay Area) can interpret the concept to fit their unique community. 

Gregory Tung spoke to the Willow Glen Neighborhood Association (WGNA) last year and was also involved in the Willow Glen Town Square project that has added so much to the Willow Glen community.

To download Michael Freedman's report on corridor revitalization, click: "Restructuring the Commercial Strip" (PDF, 16.3MB).

Thanks to the Grand Boulevard Initiative, SamTrans, and PenTV

Wednesday, January 30, 2013

San Jose: Road and trail improvement projects in process.


Shopping on the Avenue (Willow Glen)
photo: WGBA website
 As chair of the city of San Jose's Bicycle and Pedestrian Advisory Committee (BPAC) I recently signed a letter of support for funding for various transportation projects in the city.  The city will be submitting grant requests for the projects listed below. Funding is through the One Bay Area Grant Program (OBAG) administered by the Metropolitan Transportation Commission (MTC). 

OBAG is investing roughly $800 million over a four-year period (FYs 2012-13 through 2015-16), funded through continuations of the current surface transportation legislation currently known as SAFETEA (the Safe, Accountable, Flexible, Efficient Transportation Equity Act).
.
OBAG will better integrate the Bay Area region’s federal transportation program with California’s climate law (Senate Bill 375, Steinberg, 2008) and the Sustainable Communities Strategy.

Please note the city will apply for these grants individually and these grants are on a competitive basis with other Bay Area (the nine-county region) cities, counties, and agencies. These projects are in the very initial, or conceptual stages (with the exception of the first project, the Alameda "Beautiful Way").  These grants will help fund the planning and design phases of the projects. Most of the projects have not been put before the public in community meetings. That will be included in a later phase.

I have included at map at the bottom to illustrate approximate citywide locations where possible.

  • The Alameda “Beautiful Way” Grand Boulevard Phase 2
  • St. John Complete Street Corridor:  HP Pavilion to St. James LRT Station
  • Cottle Light Rail – Urban Village Connection
  • East San Jose Bike/Ped/Transit Connections
  • Penitencia Creek Trail Connection to Berryessa BART Station
  • San José PDA Pedestrian Oriented Traffic Safety Signals Program
  • San José PDA Ped/Bike/Transit Safety Lighting Program
  • Jackson Complete Streets
  • Autumn Parkway Extension – Diridon Transit Center Area
  • Almaden/Vine “Livable Streets” Couplet Conversion
  • Willow Street/Bird Avenue “Road Diet” and Three Creeks Trail Connection
  • Oakridge/Almaden Urban Village Trail & Transit Connections


View OBAG - One Bay Area Grant Request in a larger map

Monday, January 28, 2013

Book Review: Boomerang by Michael Lewis

Boomerang: Travels in the New Third WorldBoomerang: Travels in the New Third World by Michael Lewis
My rating: 4 of 5 stars

This book was classic Michael Lewis in that he deconstructs quantitatively driven scenarios and converts them into easily digestible stories albeit, with interesting characters. To imply that the author is an economic academic, rather than the journalist that he is, is stretching one's expectations.

Throughout the book he use the metaphor of what individuals or countries do with a pile of cash or credit once the lights have been turn off (left to our own private desires). In the case of the United States, we all went out and bought bigger houses. But the bigger picture he spins in the last chapter is that we wanted it all (until we were "too fat to fly"), we had grown used to having an economy of abundance that we decided to continue with the delusion even though it would have long term consequences. As he states in his last chapter:

"...And as he (Vallejo's new City Manager, Phil Batchelor) talked about the bankrupting of Vallejo I realized that I had heard this story before, or a private-sector version of it. The people who had power in the society, and were charged with saving it from itself, had instead bled the society to death. The problem with the police officers and firefighters isn't a public-sector problem; it isn't a problem with government; it's a problem with the entire society. It's what happened on Wall Street in the run-up to the subprime crisis. It's a problem of people taking what they can, just because they can, without regard to the larger social consequences. It's not just a coincidence that the debts of cities and states spun out of control at the same time as the debts of individual Americans. Alone in a dark room with a pile of money, Americans knew exactly what they wanted to do, from the top of society to the bottom. They'd been conditioned to grab as much as they could, without thinking about the long term consequences. Afterward, the people on Wall Street would privately bemoan the low morals of the America people who walked away from their subprime loans, and the American people would express outrage at the Wall Street people who paid themselves a fortune to design the bad loans..."


The last chapter also touches on the fiscal problems of San Jose, a city with the second highest level of per capita incomes in the U.S., after New York City, and yet, "is not all that far from being bankrupt".

All in all a good entertaining read which includes a globetrotting narrative into the stories and background of the European debt crisis. But if you remember to tell yourself that this is no financial thesis you enjoy the book as I did.


View all my reviews

Saturday, January 26, 2013

This is South Carolina but it could be anywhere USA

Thanks to Chuck Mahron over at Strong Towns with a post of this video. The original productions has been overdubbed into so many permutations, but this is the first I've seen having to do with transportation planners. Enjoy.


Friday, January 25, 2013

Could New York soon become safer than San Jose?

Interesting article posted by the Associated Press yesterday afternoon on the significant decrease in the homicide rate in New York during the Bloomberg administration. Last year the city experienced 418 homicides, the lowest number since reliable statistics have been kept since 1963. In 1990, New York City had an all-time high of 2,245 killings.

A couple of other interesting statistics from the article are that each year on average 33 people each down die due to homicides (over 12,000 annually) and 40 Americans commit suicides with a gun each day (over 14,500 annually).

Using quotes from the article for New York and Chicago and data from a homicide map that was produced by the Bay Area News Group I came up with some statistics of homicides per 100,000 residents

All homicides are for 2012. Population figures are from Wikipedia.

San Jose
46/958956=.000048               4.8 per 100,000 residents

New York

418/8224910=.000051           5.1 per 100,000 residents

Chicago
487/2707120=.00018            18.0 per 100,000 residents


View 2012 San Jose homicide map in a larger map

Monday, December 17, 2012

Tragedy revisited

Congresswoman Jackie Speir (l)
and I  in her DC office.
OK, here is another weird six degrees of separation story. 

With all of the tragedy experienced in Connecticut, Senator Diane Feinstein has been in the news recently. Her repeated attempts at a ban on assault weapons has taken on a renewed vigor in the wake of the senseless murder of children in Sandy Hook

It goes back to November - December of 1978, I was living in Napili, north of Lahaina on Maui, Hawaii. At the time I was working at the Sheraton Hotel at Black Rock in Kaanapali, while taking a brief break from college. As I went to work at the restaurant one evening I heard the news about the Jonestown massacre where Leo Ryan was shot to death and his 28 year-old congressional staffer Jackie Speier was shot five times and left for dead in the Guyanese jungle.

Mountain Biking legend Gary Fisher (r)
and I outside Senator Diane Feinstein's
office in the Hart Senate Bldg.
Meanwhile in San Francisco after Dan White had recently announced his resignation from the San Francisco Board of Supervisors. After reconsidering, he intended to lobby Mayor George Moscone to ask for his seat back. When the news reached the SF Bay Area of the deaths of almost 1,000 members of Jim Jone's church, nearly all from the Bay Area, the mayor delayed while the city mourned the tragic events. 

On November 27, Moscone had already decided to appoint someone else for the seat and it was on that day that Milk went to Moscone's office only to be confronted by an unknowing Feinstein as he was on his way out and en route to kill Harvey Milk. Later Feinstein would be appointed Mayor. 

Showing off a Congressional Record from the
111th Congress. Thanks Rep. Speier.
Later a grieving Moscone family would arrive on Maui during December of that year. I was also working room service at the Hotel and would deliver the gift baskets and food to the family at their cottage near the beach. Now it is easy to see why Senator Feinstein, having been directly affected with two major tragedies would respond to the Sandy Hook tragedy the way she has. 

Recently on visits to our nation's Capitol I would call upon Senator Feinstein and Congresswoman Speier sympathetic to how the tragedy had effected their own lives. It is somewhat strange how later on I would meet these two women whose lives had been effected with violence and tragedy.


Saturday, October 27, 2012

Walking school buses as the new transportation trend


The following article was recently featured on the Metropolitan Transportation Commission's website and was written by Craig Noble.

Studies show that fewer children are walking and biking to school, but there’s a new trend in transportation that could reverse that. It’s called the walking school bus, although it has no wheels. Instead, it’s simply a group of children walking to school with one or more adults. The walking school bus is a safe, fun and convenient way to get to class. It also reduces air pollution from extra driving.
Walking school bus programs were trail blazed by the national Safe Routes to School program, which according to the National Center for Safe Routes to School, promotes “sustained efforts by parents, schools, community leaders and local, state, and federal governments to improve the health and well-being of children by enabling and encouraging them to walk and bicycle to school.” The program also seeks to reduce emissions of the greenhouse gas emissions that cause climate change by shifting the mode of travel away from single family vehicle use.

Photos from a recent Walk to School Eventi
n the Willow Glen neighborhood of
San Jose
Now walking school buses are attracting attention across the Bay Area. In fact, The Daily Republic newspaper recently reported that Solano County has set a goal of starting a walking school bus at all 56 elementary schools in the county.
One of the Bay Area’s most established walking school bus programs is in Alameda County. The program is implemented in nearly every school district in the county, for a total of 96 schools in 2012. These include 75 elementary schools, 15 middle schools and six high schools. The program started with just two schools in Oakland in July 2007.

A complete list of participating county schools is available from the Alameda County Safe Routes to School Program. The county’s program is funded by a nearly $3 million grant from MTC plus a nearly $380,000 match from Measure B, Alameda County’s half cent transportation sales tax (administered by the Alameda County Transportation Commission). MTC has provided a total of $15 million to Bay Area counties for the Regional Safe Routes to School Program, and it will continue to fund the program at $5 million per year over the next four years.

“We are certainly one of the largest and most comprehensive Safe Routes to School programs in the country,” said Nora Cody, program director for the Safe Routes to School Alameda County Program. “We are very proud of our socioeconomic and geographic equity, serving urban and suburban schools, multiple languages and challenging demographics. We are seeing mode shift, and we are engaging thousands of families who are eager to embrace healthier ways to school.”

Thursday, October 25, 2012

Megabus returning to the west coast?

Megabus coming to the Bay Area
My good friend Richard over at Cyclelicious informs me that he spotted a Megabus in San Jose this morning. He says that he spoke with the bus driver who stated that they are doing some test runs in the area. Megabus first launched its U.S. fleet in April of 2006 and currently serves 80 cities across North America.

When the system was running through San Jose I was very impressed. On one occasion I got a $3 ticket and the ride only took around 6 hours from Los Angeles' Union Station to San Jose's Diridon Station (see map). That works out to less than 1 penny per mile at about 60 mph pace!

Megabus used to run a San Francisco to Los Angeles Union Station route about four years ago. The bus used to make a stop right at Diridon Station. So before your groan and compare Megabus to Greyhound bus lets go over some major differences.

Try the new Megabus phone app.
  • Megabus is a British based company that currently has bus stops in 37 states and the province of Ontario. 
  • Buses are new and immaculate, most are double decker style with on board wi-fi, at seat plug-ins
  • Unlike Greyhound they own no property but rely on cities allocating convenient bus stops in high traffic areas.
  • Ticketing is all done online.
  • The unique feature of Megabus is that the first ticket for a run is always $1 and goes up from there, making the bus line very affordable.
  • Unfortunately Megabus does not carry bicycles on board or in the luggage compartment.
 Megabus is extremely popular amoung students in the heavily traveled Washington DC to New York to Boston corridor, competing with Amtrak's Acela train.

 Megabus also has a mobile phone app which you can find using the QR code located on the right. They have an app for both the iPhone IOS systems and the Android system.

I'll try to keep you posted on any details.

Thanks for the heads up, Richard!